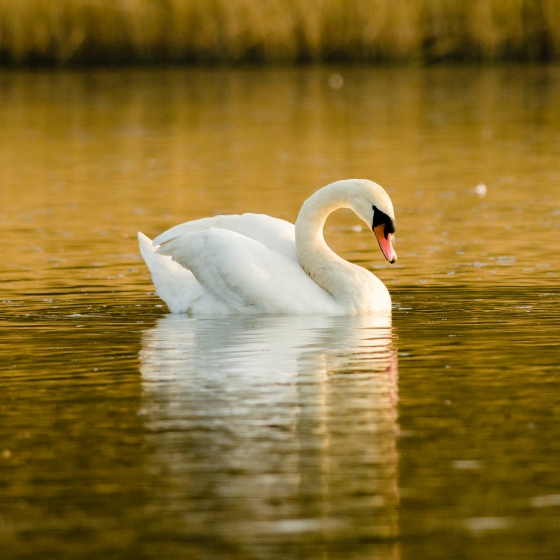
Mute Swan
Introduction
Encompassing grace and power, the familiar Mute Swan can be seen all year round on suitable waterbodies.
The large size and bright white plumage make adult Mute Swans unmistakeable. They can be separated from the wintering swan species by their orange bill (in contrast to the yellow and black bills of Whooper and Bewick's Swans).
The Mute Swan represents the archetypal ugly duckling; the grey cygnets transform through grey-brown into white adults during their first year. Breeding usually commences at four years of age. Whilst many breeding pairs are territorial, the species can be seen in relatively large numbers in winter or where supplementary feeding occurs. The Wetland Bird Survey has recorded hundreds of individuals at some sites.
- Our Trends Explorer gives you the latest insight into how this species' population is changing.
Key Stats

Identification
ID Videos
This section features BTO training videos headlining this species, or featuring it as a potential confusion species.
Wild Swans
Songs and Calls
Call:
Alarm call:
Status and Trends
Conservation Status
Population Change
Mute Swan populations, which had been fairly stable since the 1960s, increased progressively from the mid 1980s to around 2000, when a new plateau was reached. Waterways, likely to be a preferred habitat for breeding swans, show a more moderate rate of increase than CBC/BBS. Winter trends have shown a parallel upturn, with little change in Britain after 2000 (WeBS: Frost et al. 2020). After a spell on the green list during 2009-15 the species is now amber listed once more, through the international importance of its UK wintering population (Eaton et al. 2015). The species has increased across Europe since 1980 (PECBMS: PECBMS 2020a>).
Distribution
The Mute Swan is largely sedentary, and the winter and breeding distributions are very similar. It is widespread across Britain & Ireland, though generally absent from higher ground, and occupies a wide range of lowland habitats. During the breeding season the nests are often conspicuous and it is relatively easy to confirm breeding.
Occupied 10-km squares in UK
or view it on Bird Atlas Mapstore.
or view it on Bird Atlas Mapstore.
European Distribution Map
Distribution Change
There was little change in breeding distribution between the 1968–72 and 1988–91 Breeding Atlases. The most striking change in the distribution of the Mute Swan is its expansion into Shetland, where it now winters and is a confirmed breeder.
Change in occupied 10-km squares in the UK
or view it on Bird Atlas Mapstore.
or view it on Bird Atlas Mapstore.
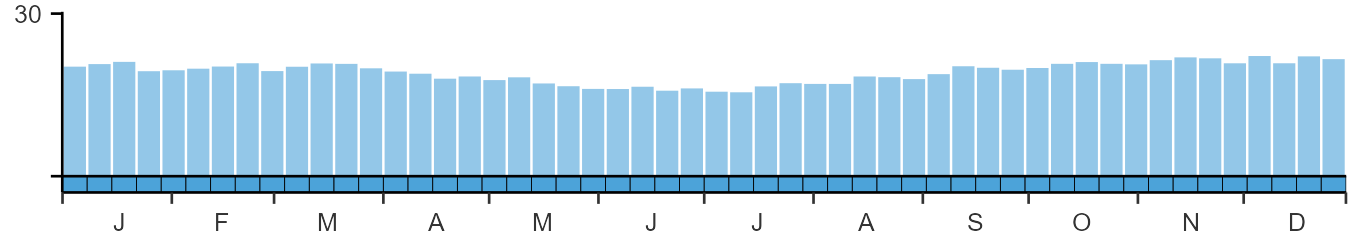
Seasonality
Mute Swan is a year-round resident recorded on up to 20% of lists.
Weekly pattern of occurrence
The graph shows when the species is present in the UK, with taller bars indicating a higher likelihood of encountering the species in appropriate regions and habitats.
Habitats
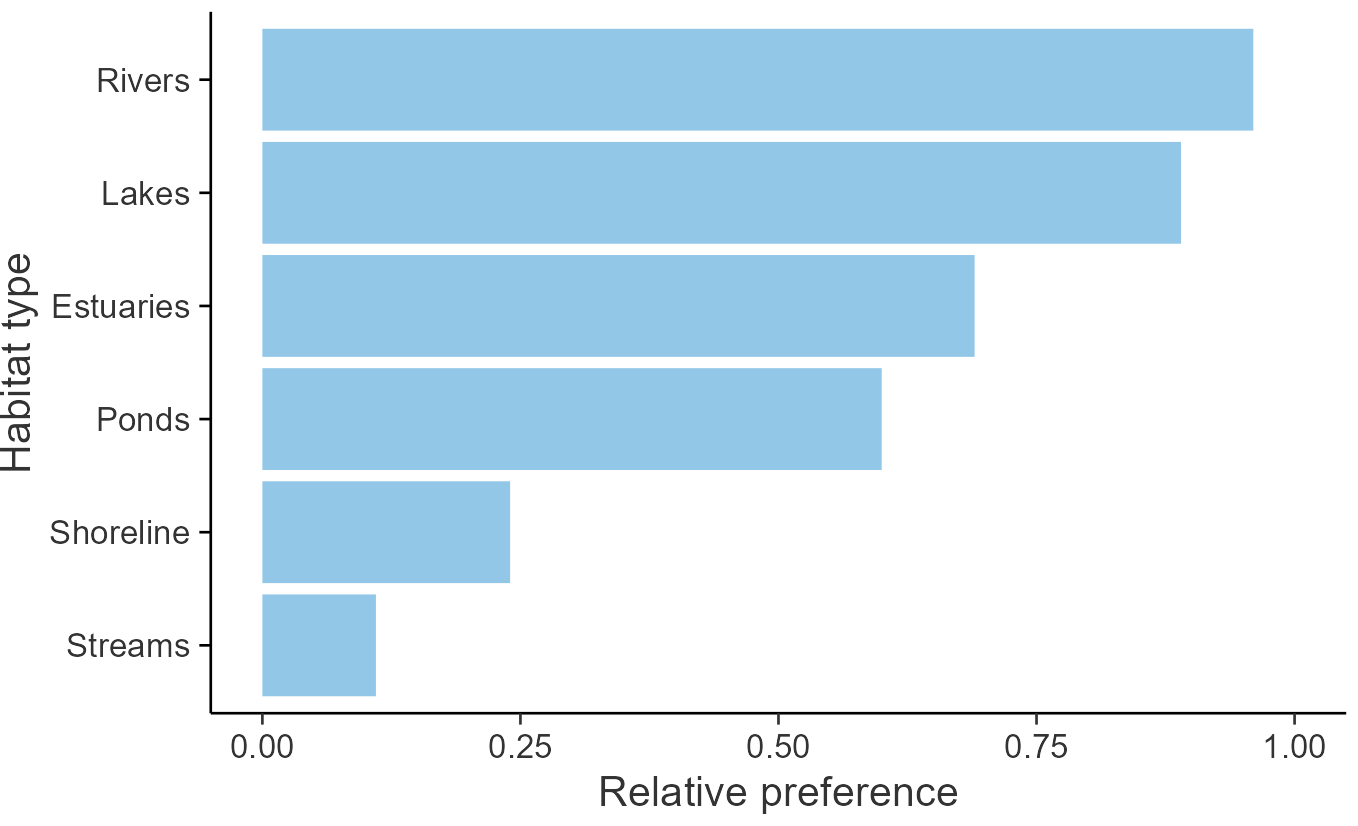
Breeding season habitats
Relative frequency by habitat
The graph shows the habitats occupied in the breeding season, with the most utilised habitats shown at the top. Bars of similar size indicate the species is equally likely to be recorded in those habitats.
Movement
Britain & Ireland movement
Foreign locations of birds ringed or recovered in Britain & Ireland
Dots show the foreign destinations of birds ringed in Britain & Ireland, and the origins of birds ringed overseas that were subsequently recaptured, resighted or found dead in Britain & Ireland. Dot colours indicate the time of year that the species was present at the location.
- Winter (Nov-Feb)
- Spring (Mar-Apr)
- Summer (May-Jul)
- Autumn (Aug-Oct)

European movements
EuroBirdPortal uses birdwatcher's records, such as those logged in BirdTrack to map the flows of birds as they arrive and depart Europe. See maps for this species here.
The Eurasian-African Migration Atlas shows movements of individual birds ringed or recovered in Europe. See maps for this species here.
Biology
Productivity and Nesting
Nesting timing
Egg measurements
Clutch Size
Incubation
Survival and Longevity
Survival is shown as the proportion of birds surviving from one year to the next and is derived from bird ringing data. It can also be used to estimate how long birds typically live.
View number ringed each year in the Online Ringing Report.
lifespan
Survival of adults
Survival of juveniles
Biometrics
Wing length and body weights are from live birds (source).
Wing length
Body weight
Ring Size
Classification, names and codes
Classification and Codes
- Order: Anseriformes
- Family: Anatidae
- Scientific name: Cygnus olor
- Authority: JF Gmelin, 1789
- BTO 2-letter code: MS
- BTO 5-letter code: MUTSW
- Euring code number: 1520
Alternate species names
- Catalan: cigne mut
- Czech: labut velká
- Danish: Knopsvane
- Dutch: Knobbelzwaan
- Estonian: kühmnokk-luik
- Finnish: kyhmyjoutsen
- French: Cygne tuberculé
- Gaelic: Eala
- German: Höckerschwan
- Hungarian: bütykös hattyú
- Icelandic: Hnúðsvanur
- Irish: Eala Bhalbh
- Italian: Cigno reale
- Latvian: paugurknabja gulbis
- Lithuanian: gulbe nebyle
- Norwegian: Knoppsvane
- Polish: labedz niemy
- Portuguese: cisne-mudo
- Slovak: labut velká
- Slovenian: labod grbec
- Spanish: Cisne vulgar
- Swedish: knölsvan
- Welsh: Alarch Dof
Research
Causes of Change and Solutions
Causes of change
The increase in this species has been attributed to the banning of lead weights for fishing and the positive implications of this on survival. Milder winters may also have also been a factor, increasing overwinter survival and having knock-on effects on breeding success, although a recent study found no evidence in support of any long-term effect of winter temperatures on the population.
Further information on causes of change
The main hypothesis relating to the factors causing the increase in this species concerns the use of lead as fishing weights (Rowell & Spray 2004, Ward et al. 2007). In the late 1970s lead poisoning was shown to be the largest single cause of death among Mute Swans in England, accounting for the deaths of 3,000-3,500 birds annually (Kirby et al. 1994). There is good evidence showing that lead contamination of Mute Swans in England caused local population declines during the late 1970s and 1980s (Blus 1994, Birkhead & Perrins 1985). The increase in the British Mute Swan population seen between the 1983 and 1990 censuses can thus be explained partly by the ban on the use of lead weights in fishing imposed by the Water Authorities in 1987 (Rowell & Spray 2004). There is no evidence to suggest that lead poisoning was ever a problem in Scotland (e.g. Brown & Brown 1984).
A second, not mutually exclusive, hypothesis is that warmer winter weather has benefited this species. Deaths during the winter due to poor weather are an important cause of mortality in many areas (Spray 1981, Perrins & Sears 1991) and a run of mild winters is likely to have reduced this (Rowell & Spray 2004). Mild winters are not only associated with low mortality but are also followed by high reproductive output (Delany et al. 1992) which has also contributed to the increase in the Mute Swan population. A study examining five years' data on breeding biology found that winter temperature was one of the factors significantly affecting the date of laying, which in turn was related to clutch size, which in itself was the most significant factor determining the number of cygnets fledged (Birkhead et al. 1983), hence demonstrating an effect on breeding performance. Esselink & Beekman (1991) have also shown that mild winters are not only associated with low mortality but are also followed by high reproductive output be enabling adults attain peak body condition. This may have been particularly important in Scotland.
Whilst the recovery of the British Mute Swan population may in large part be attributed to the reduced incidence of lead poisoning, locally other factors may have had an equal contribution to the observed changes (Ward et al. 2007). Recent years have also seen an increase in the availability of suitable breeding habitats, in the form of the large numbers of gravel pits and ponds that have been created. Improvements to the water quality of rivers and canals, as a result of efforts to reduce pollution, may have also helped the species (Coleman et al. 2001, Rowell & Spray 2004). The number and activity of Swan Rescue Centres may also have an effect on the Mute Swan population size (Delany et al. 1992, Perrins & Martin 1999), although there is little documented evidence to support this. Other factors affecting local populations include increased protection of nesting birds; in an English Midlands study area, this was considered a key factor in the reversal of the 1960s and 1970s decline (Coleman et al. 2001).
In Scotland (and presumably elsewhere), the increased autumn sowing of cereals has improved the winter food supply for swans, enabling a higher proportion of birds to survive the winter (Delany et al. 1992, Ward et al. 2007), although there are no specific analyses to support this.
Wood et al. (2019) investigated some of the above hypotheses by examining the inter-annual variation in the Mute Swan population in Great Britain between 1974 and 2012, and concluded that the trends were best explained simply by the banning of lead weights rather than by winter temperature, water quality, the extent of agricultural food resources or by a combined model which included more than one of these four co-variates.
Information about conservation actions
The recent increasing trend for this species has been attributed to the banning of lead weights, with other factors including improvements in water quality and wetland habitats possibly also contributing to the trend. As there are currently no conservations concerns, no specific conservation actions are currently required; however, ongoing local management actions and wider policies to maintain favourable conservation status include ensuring that water quality is monitored, and that suitable good quality wetland habitat is maintained. The use of flight diverters on power lines to make them visible to swans has successful reduced mortality caused by collision with them (Frost 2008), although there is no evidence that collisions have had an effect at a population level.
There is some evidence to suggest that Mute Swans can reduce the abundance of plant biomass along some chalk streams (O'Hare et al. 2007); Wood et al. 2014), with no simple conservation management solutions yet available to limit potential negative effects of Mute Swans on the stream ecosystem.
Publications (1)
Waterbirds in the UK 2023/24
Author: Calbrade, N.A., Birtles, G.A., Woodward, I.D., Feather, A., Hiza, B.M., Caulfield, E.B., Balmer, D.E., Peck, K., Wotton, S.R., Shaw, J.M. & Frost, T.M.
Published: 2025
The report provides a single, comprehensive source of information on the current status and distribution of waterbirds in the UK for those interested in the conservation of the populations of these species and the wetland sites they use.Key stories from this report include more updates on avian influenza affecting migratory Barnacle Goose and Mute Swan, as well as a focus on the latest WeBS Alerts, looking at how wintering waterbirds are doing in protected areas.View the press release for this report
22.05.25
Reports Waterbirds in the UK