The latest updates of the UK and England bird indicators based on the population trends of wild bird species were published on 12 November 2024. They report on the population trends of birds over the long term (in most cases, since 1970) and the most recent short-term period (in this case 2018–23).
Summary information for each indicator is included below. You can also view the full details on the Defra website: Indicators for the UK and England 2024.
- Indicators for the UK and England are produced jointly by BTO and RSPB for Defra.
Indicator for all UK breeding bird species
The combined ‘all-species indicator’ is comprised of the population trends of 130 bird species that breed in the UK. It has shown a shallow decline of 15% over the last 45 years, and has declined 6% over the most recent five-year period (2017–22).
This overall pattern masks considerable variability between the trends for different species, with some increasing and some decreasing. Changes by habitat are summarised in each of habitat-specific indicators.
fig1_allspecies_indicator.png

UK breeding bird farmland indicator
As seen in previous years, the breeding farmland bird indicator continued to fall and has declined by 60% between 1970–2022.
Whilst most of these declines occurred in the late 1970s and early 1980s, declines are ongoing and there was a marked short-term decline of 8% between 2017–2022.
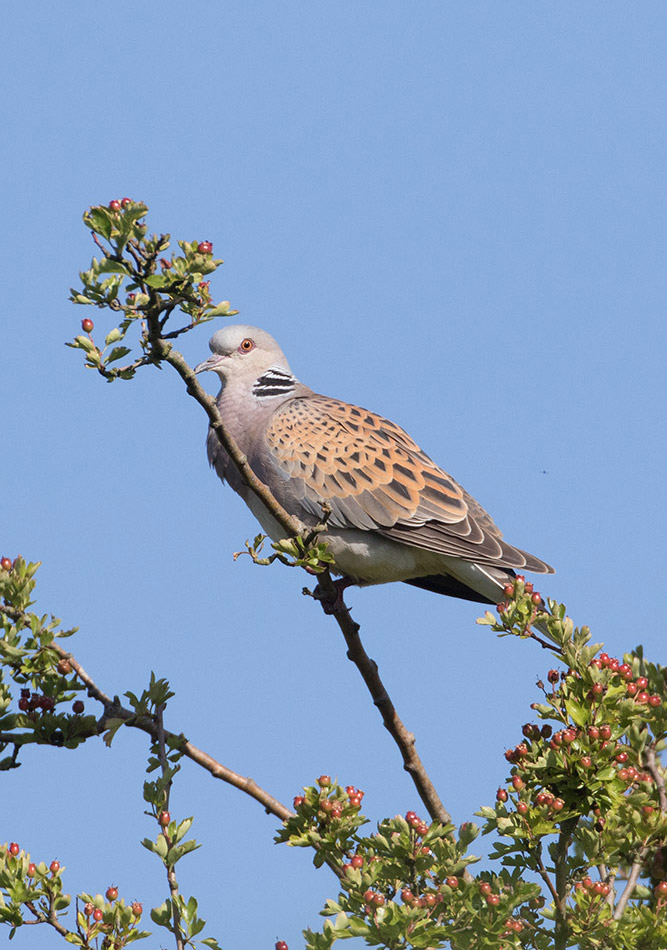
Farmland specialists showed the most prominent declines; for example, Corn Bunting, Grey Partridge, Turtle Dove and Tree Sparrow have all declined by at least 90% since 1970. This is largely attributed to changes in the way farmland has been managed over the past five decades, such as spring sowing and the loss of winter stubble, loss of hedgerows and other semi-natural features, and increased fertiliser and pesticide use.
However, the numbers of some farmland specialists (e.g. Stock Dove and Goldfinch) have more than doubled since the 1970s. This illustrates that responses to pressures vary between species, with some species better able to cope by exploiting new crops and food sources, or benefitting from agri-environment schemes.
UK breeding woodland bird indicator

The breeding woodland bird index for the UK has declined by 37% between 1970–2022, and by 15% just over the recent short-term period from 2017–2022. This means that woodland birds are currently our most rapidly-declining group.
There are significant declines in many woodland specialists, but also in long-distance migrant species that breed in our woodland in the summer and spend winters in sub-Saharan Africa.
Generalist woodland species, typically those that also breed in gardens or wooded areas of farmland, show little overall change – about a 5% decline since 1970. However, some earlier increases have been followed by a sharper decline of 10% in the last five years.
Woodland species such as Lesser Spotted Woodpecker, Spotted Flycatcher and Willow Tit have shown the steepest declines (greater than 80%) since 1970.
Conversely, numbers of Blackcap and Nuthatch have almost doubled, and the Great Spotted Woodpecker is more than three times as abundant as it was several decades ago.

UK breeding birds of wetlands and waterways indicator

The breeding water and wetland bird index for the UK fell by 13% between 1975–2022, but over the short term shows little change – a decline of only 3%.
Over the long term, species associated with slow-flowing and standing water, and with reedbeds, fared better than those associated with fast-flowing water or with wet grasslands.
Lapwing, Redshank, Snipe and Common Sandpiper showed the strongest declines over the long term, whereas Mute Swan and ducks including Mallard, Tufted Duck and Teal have increased.
This indicator is based on trends calculated from a combination of Breeding Bird Survey and the more riparian-focused Waterways Breeding Bird Survey data, as well as their predecessors.

UK upland breeding bird indicator

This update of the wild bird indicators includes for the second time an Upland Bird Indicator, which has been developed over the past few years.
This is a composite indicator constructed from the population trends of upland bird specialists as well as the populations of more widespread species monitored on upland Breeding Bird Survey sites. It is largely based on data from the Breeding Bird Survey, which began in 1994, so the indicator covers the period from 1994–2022.
Overall, the upland bird indicator declined by 13% between 1994–2022, and by 5% between 2017–22.
However, breaking down the 32 species into three subgroups – upland specialists, upland riverine species, and non-specialists with large populations in the uplands - reveals further patterns: upland specialists have declined by 20% since 1994, upland riverine species by 12%, and upland populations of other species by only 4%.

Breeding seabird indicator
The breeding seabird indicator has been updated this year for the first time since 2020. This is due to a combination of issues related to restrictions on site visits due to COVID-19 and more recently to avian influenza, as well as the transfer of the coordination of the Seabird Monitoring Programme from JNCC to BTO.
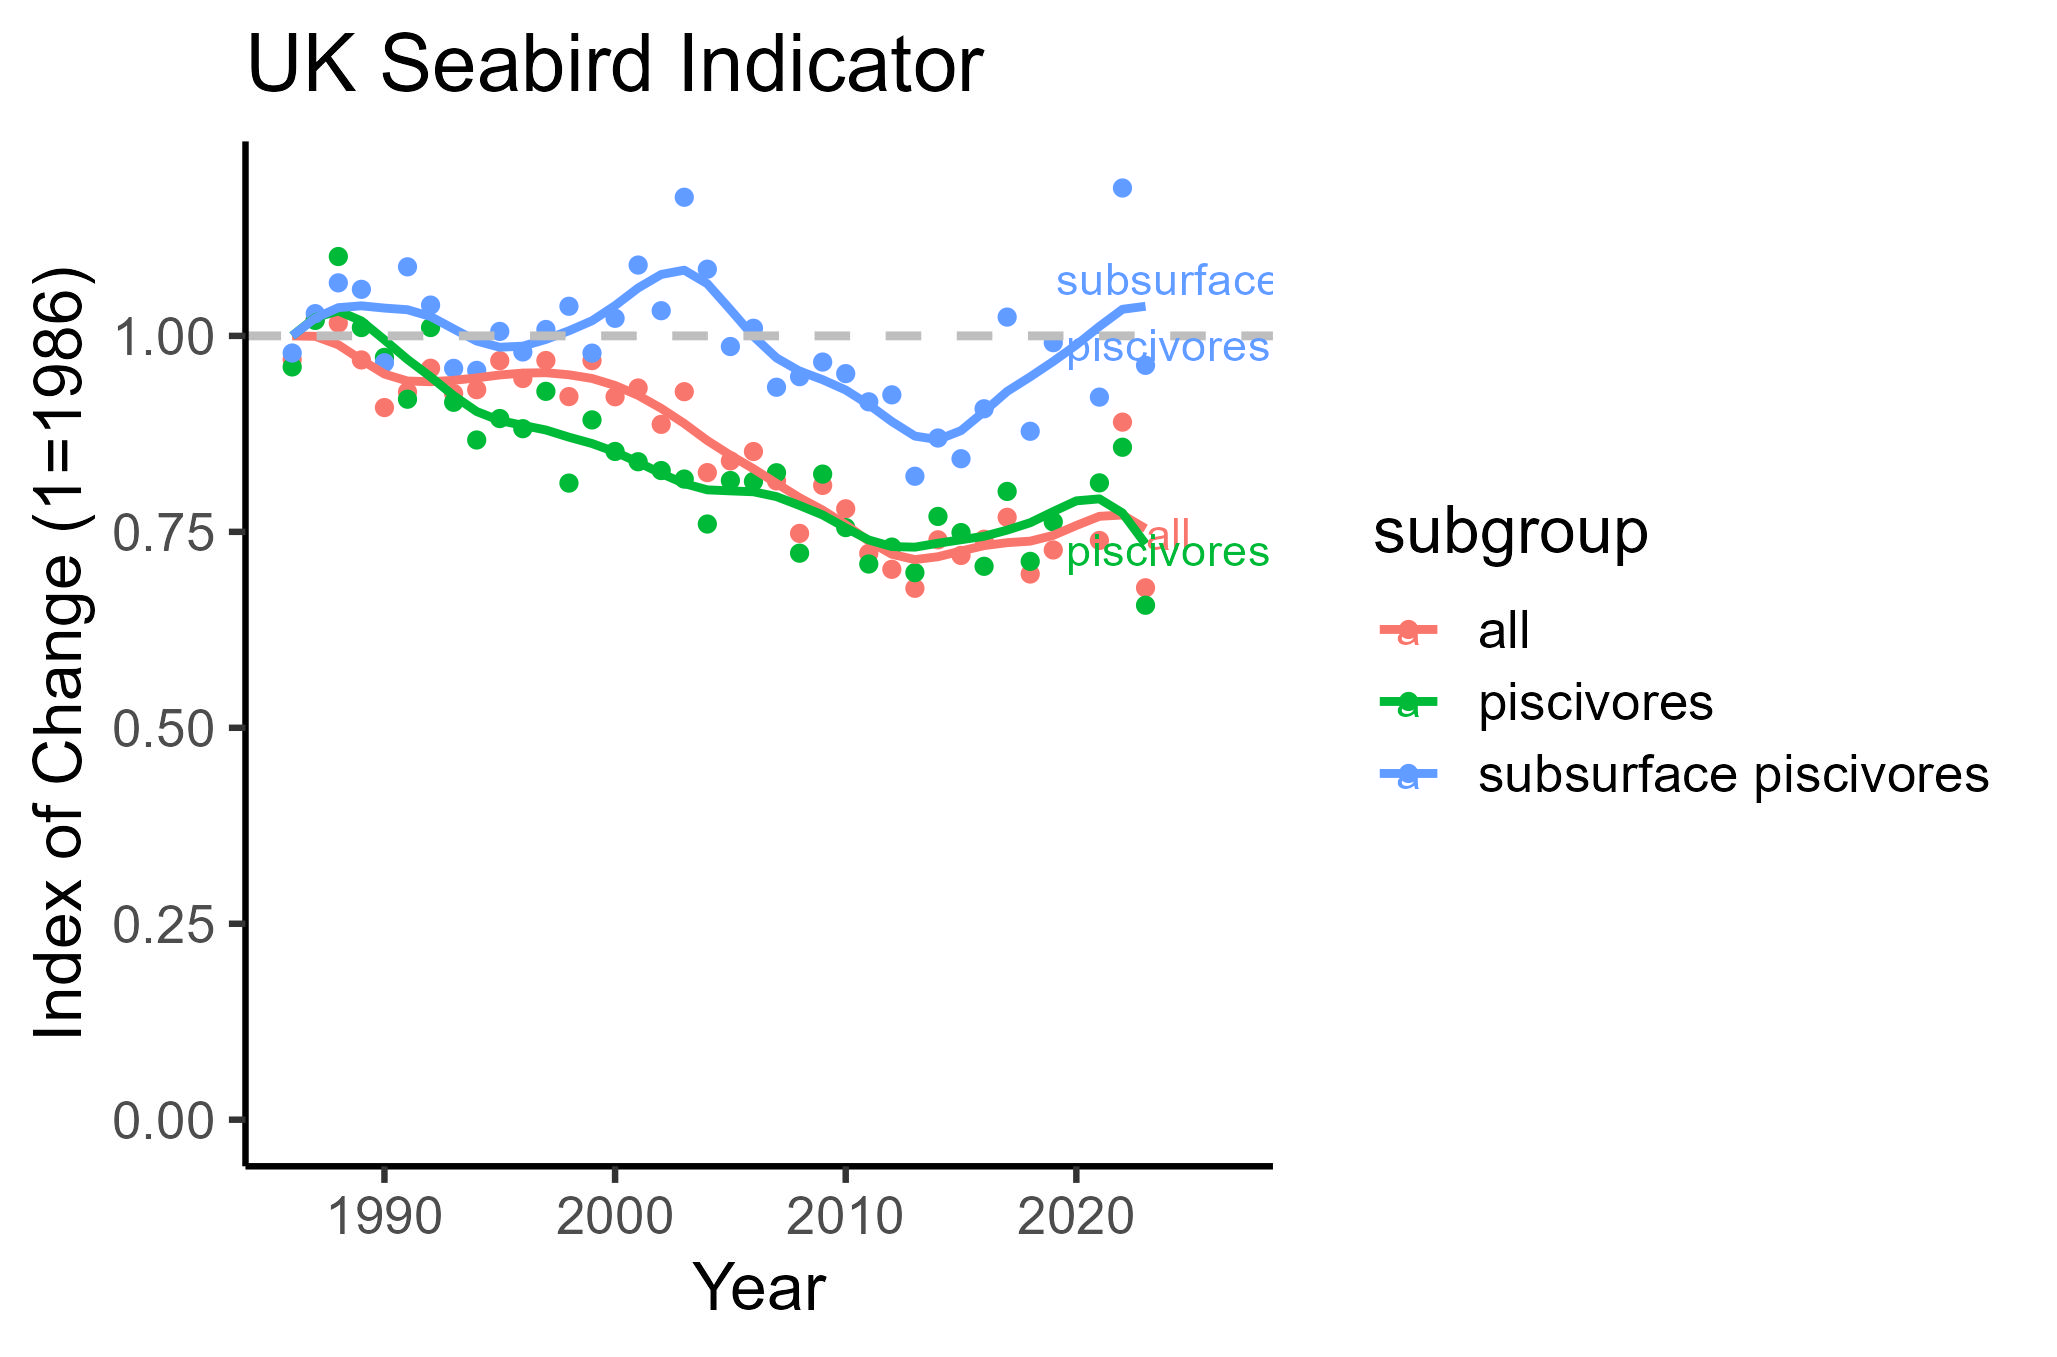
The UK seabird indicator has declined by 25% since 1986. The population showed a steady decline between 2000 and 2013 but has since shown relatively little change in the five-year short-term period since 2018.
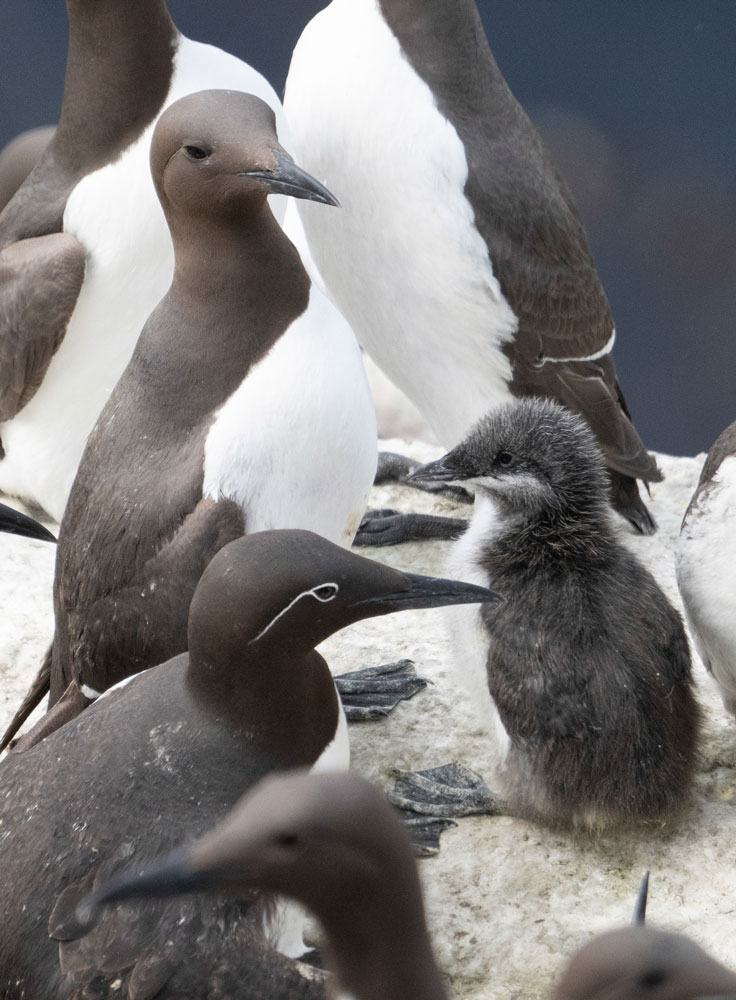
The seabird index for the UK includes individual measures for 13 species of seabird: five species are surface feeders; three species are subsurface feeders; and five forage in other ways. When interpreting these indicator trends, it should be borne in mind that each sub-habitat trend is derived from relatively few species’ trends.
Seabirds populations are impacted by a range of pressures including climate-change and fisheries induced changes in prey availability, introduced mammalian predators on islands, and disturbance. Since 2020, the onset of HPAI in Britain’s seabirds has had devastating effects on many species. Particular impacts were seen among Arctic Skua, many of the tern species and Gannet (Tremlett, Morely and Wilson, 2024). According to the UK seabird colony counts in 2023, declines of Gannet were seen across Scotland and Wales, but with corresponding increases in England. It is unlikely that the full impact of this disease outbreak is reflected in these indicators, especially as some of the most impacted species, such as Great Skua, are not included in the production of the indicators.
Wintering waterbird indicator
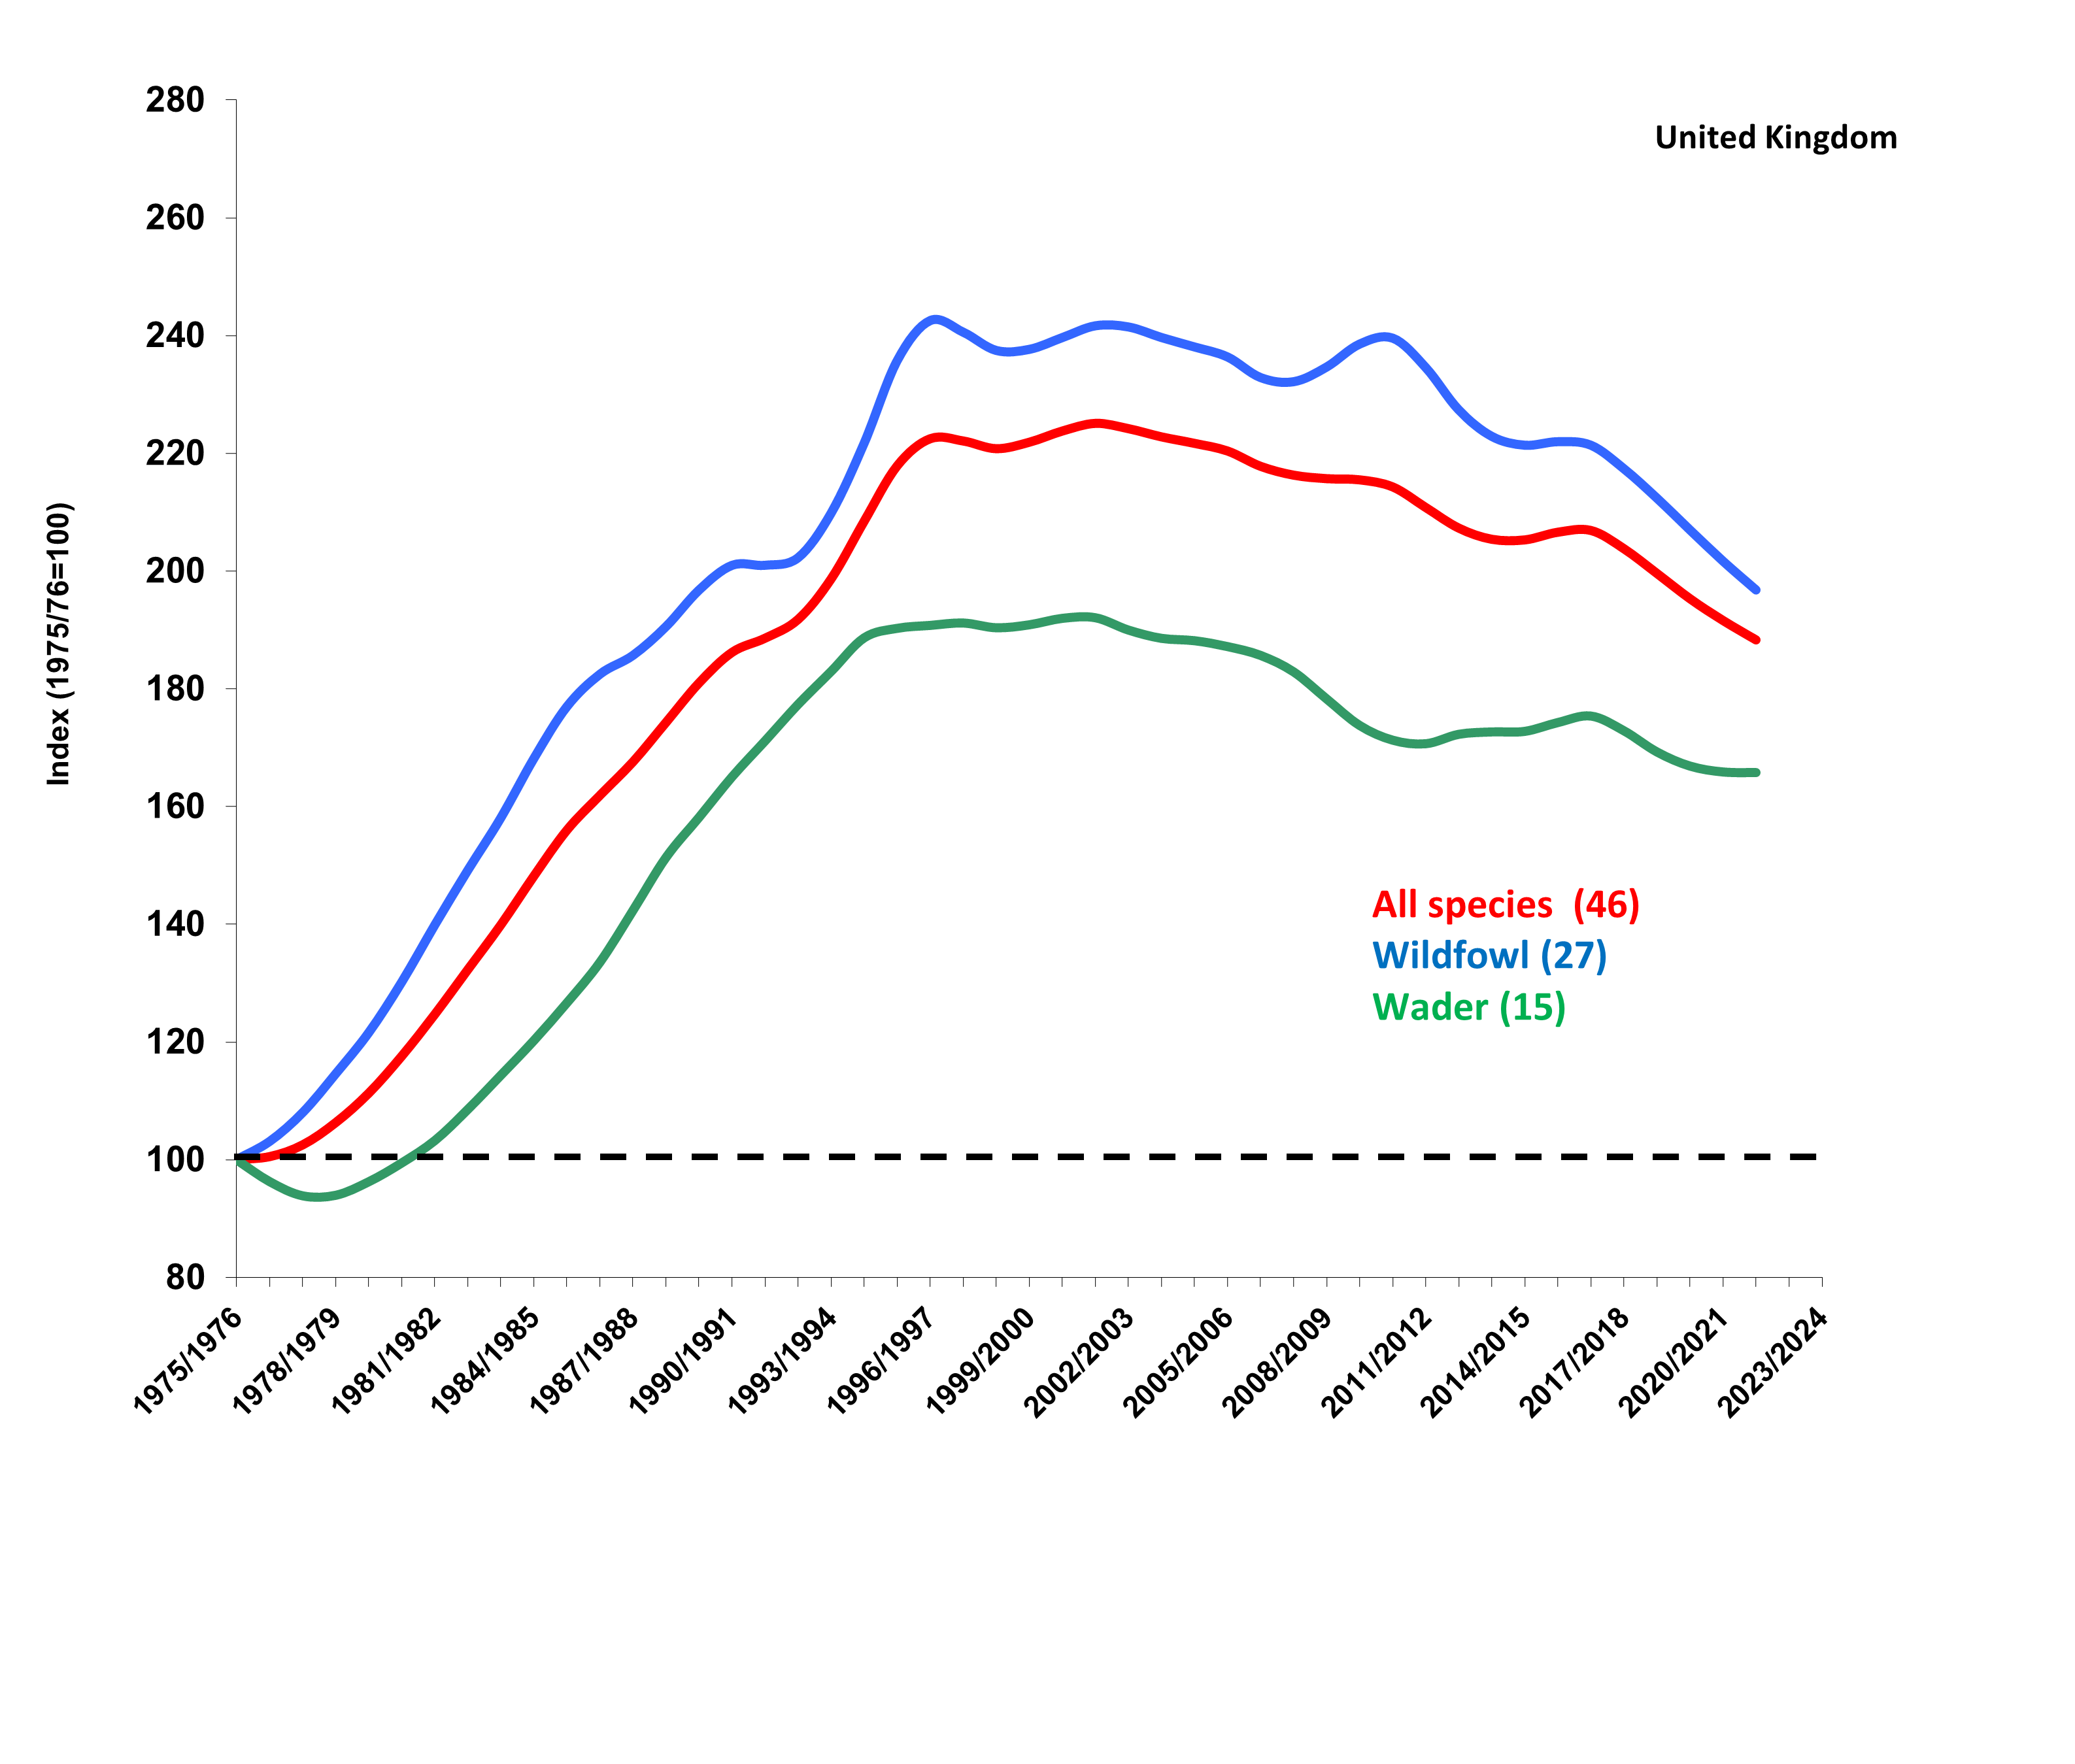
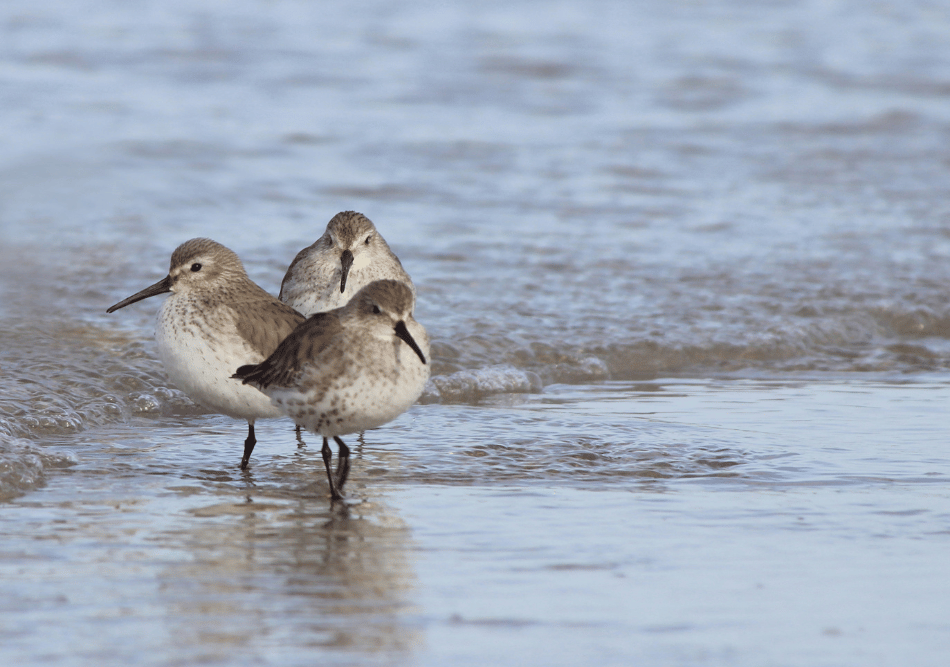 This indicator monitors the internationally important numbers of waders, ducks, geese, swans and other waterbirds that winter on our coasts and wetlands since the mid 1970s. It is largely based on data collected by the Wetland Bird Survey.
COVID-19 restrictions prevented a full set of Wetland Bird Survey counts in the 2020/21 winter, so the indicator was not updated in 2022. However, the indicator has been updated in this publication using the most recently available data, from the 2021/22 winter.
Wintering waterbirds in the UK are comprised of birds from breeding populations that fall both within and outside the UK. For example, the wintering Curlew population is made up of birds that breed in the UK's uplands and wet grasslands as well as birds that breed in Continental Europe. For this reason, the wintering waterbird indicator represents the trends of several different breeding populations of the same species.
In the winter of 2022/23, the wintering waterbird index was 90% higher than in the winter of 1975/76. However, numbers have been in decline since the peaks of the mid 1980s and the indicator fell further, by 8%, between the winter of 2017/18 and 2022/23.
 Examining the indicators for species groups, wildfowl have shown more overall increase than waders, but the indicators for both are broadly parallel. The indicators for both groups also include species with very different trends – for example, numbers of Avocet and British/Irish wintering Greylag Goose increasing in contrast to steep declines in Dunlin and Bewick’s Swan.
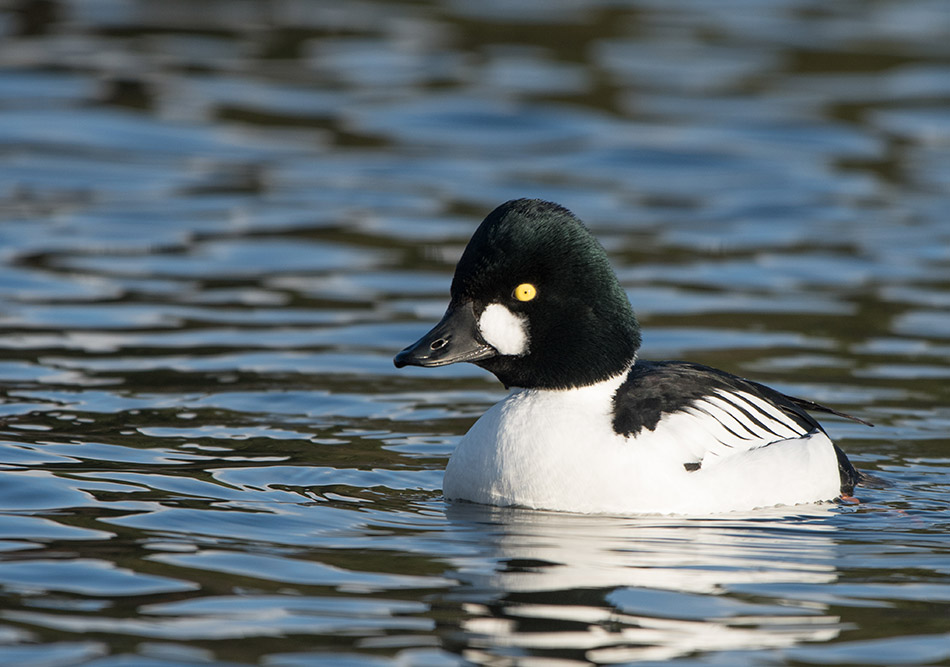
There is good evidence to suggest climate change has had a significant impact on the indicator in recent years. Milder winters across Europe mean the wintering ranges of many species, including Mallard, Pintail, Goldeneye, Pochard, Bewick’s Swan, Ringed Plover, Curlew and Bar-tailed Godwit are increasingly shifting away from the UK.
In addition, local changes such as wetland creation and shifts in agricultural management have also had a mixed impact on waterbird populations within the UK.